Sign In
News
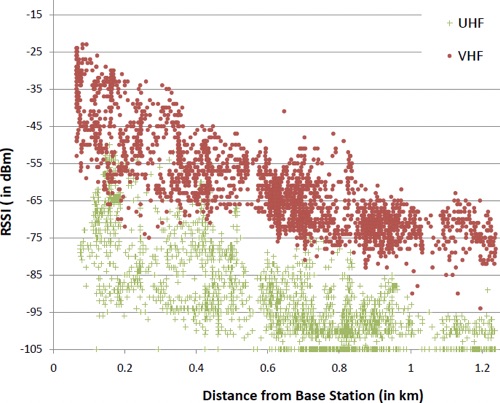
The graph at the right plots distance vs received signal strength (RSS) between a fixed base station and a mobile station that traveled along nearby streets in a suburban business park.
The green UHF samples spread 40 dBm vertically, due in part to the terrain between the two stations when the sample was taken.
For distances under 1km, terrain typically takes the form of treelines, buildings and other man-made structures. Over longer distances, it includes hills, ridges and valleys.
The UHF band occupies 470 - 700MHz and overlaps cellular's MBS band. Its 40 dBm spread clearly shows that cellular site planning must consider terrain along with distance and other factors.
A blue question mark icon lies next to Find Best' Pathloss column:
Click it and it says:
Free space path loss + horizontal and vertical 'aim back' antenna losses, using generic antenna patterns. Does NOT consider the effects of terrain.
Increasing the antenna height may reduce terrain interference. As the description above indicates, but doing so will not affect Find Best' pathloss calculations.
But why?
Pathloss computer models that consider terrain compromise accuracy, sometimes significantly. Instead, Find Best can identify sites with no terrain obstructions and order them by a simpler but more accurate free space path loss model that ignores terrain. Since, Find Best found the sites with no terrain obstructions to begin with, its pathloss calculation can ignore this complex variable that is nearly impossible to factor into an accurate pathloss calculation.
For more details about Find Best and its new Automated Terrain Analysis feature, please see this article.
In short, the power of Find Best lies in its ability to instantly analyze the terrain between the bullseye and all sites within 100km (potentially thousands) and discard those with terrain interference.
Coverage data is updated monthly for Canada Cellular Services, and bi-weekly for Australia & New Zealand Cellular Services.
For November, Canada Cellular Services sees a substantial country-wide coverage update for Telus:
This enhanced coverage is currently available only from Canada Cellular Services, produced from multiple data sources and offering better coverage than what is currently published by ISED or available from any other 3rd party.
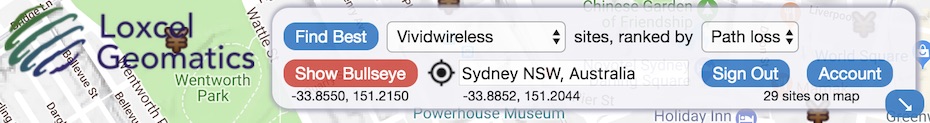
The Show Bullseye button became a bit smarter, as part of the Automated Terrain Analysis update. In the image below, the bullseye's coordinates appear in small text immediately below the button (-33.8550, 151.2150). Click and drag the bullseye to see these coordinates instantly change. As well, the button sometimes turns red:
It turns red to warn you that the bullseye lies out of view, beyond the edge of the map. When red, the Find Best button still works as usual, but be aware that the search will start from a location not in view.
You can make the bullseye reappear by panning the map in its direction (if you remember where it went), zooming out or simply clicking the Show Bullseye button, to place the bullseye back in the center of the map.
We have packaged Closest Sites and Site Terrain Graph into a single Find Best button. Click it and a couple seconds later, you're shown all nearby cellular sites with favorable terrain (eg. free Fresnel zone). It works even if there are 1,000 nearby wireless sites. We believe it will save you a time and energy.
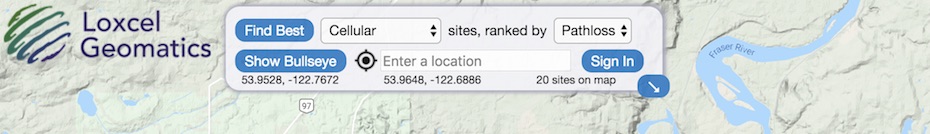
The filter (eg. Cellular) and the Show Bullseye button are central to this new service. Click the diagonal arrow in the bottom-right corner of the control panel to see more options.
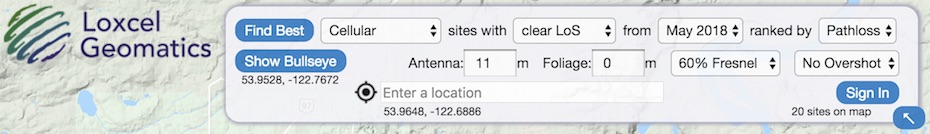
Many selections in the new control panel remain unchanged (month/year, antenna height, foliage height, Fresnel percentage and overshot) but two are new: favorable terrain (clear LoS) and rank-by (Path Loss).
The options for favorable terrain are
Clear near-LOS is the least restrictive and will return more sites; Clear Fresnel is the most restrictive and will return fewer sites. These restrictions guarantee that if there is a site with favorable terrain within 100 kilometers of the bullseye, it will now be shown!
The options for Rank-by are
Notice that the expanded control panel's first row forms a complete English sentence, describing exactly what sites to find and in what order to show them: Find Best Cellular sites with clear Line-of-Sight from May 2018 ranked by Pathloss.
Automated terrain analysis relies on many gigabytes of elevation data hosted locally on our servers. It is sourced from Natural Resources Canada, Geoscience Australia, and NASA's Shuttle Radar Topography Mission, a joint project of NASA, the German and Italian space agencies, and the National Geospatial-Intelligence Agency. This mission flew aboard the Space Shuttle Endeavour in February 2000, mapping Earth's terrain between 56° S and 60.25° N. During the 11-day mission, the crew (at right) used an imaging radar to map the surface of Earth numerous times from different perspectives. The combination of these radar data were processed at JPL to produce a global terrain map created by bouncing radar signals off Earth's surface and back to the shuttle.
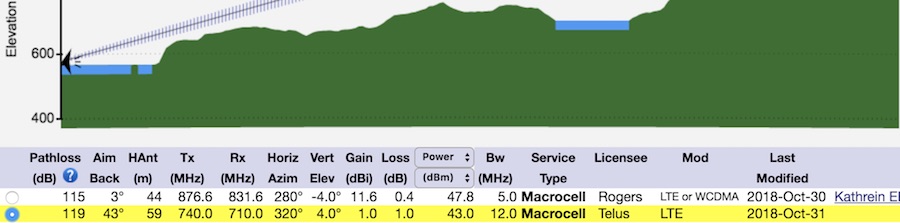
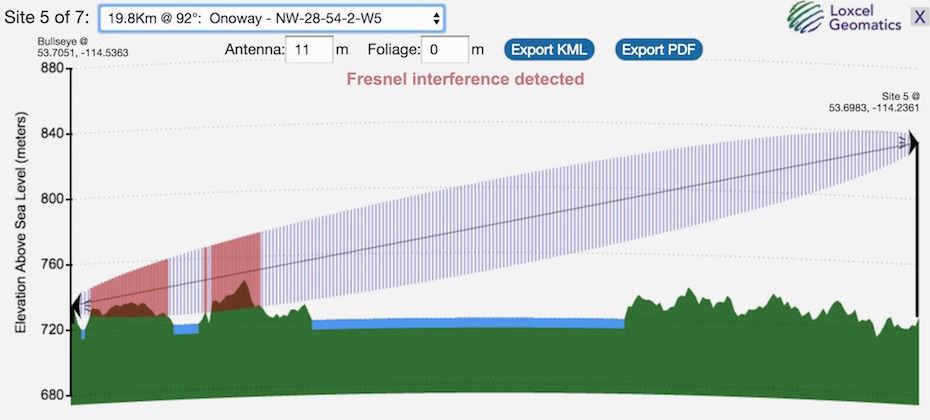
SRTM radar did not penetrate far into dense vegetation, so the green terrain profile (illustrated below) follows near the tops of dense vegetation and ground clutter of similar composition. Our analysis also uses alternate ground-based elevation data to anchor cellular structures firmly on the ground, and to calculate antenna heights.

Another enhancement shows lakes and other water bodies that lie between the bullseye (at left) and the site (at right):
Elevation data — even from NASA — is not 100% perfect, and cannot replace a physical site survey. Canada Cellular Services subscribers please note that automated terrain analysis currently supports searches below 61° N latitude.
If you have any questions about Automated Terrain Analysis, please let us know.