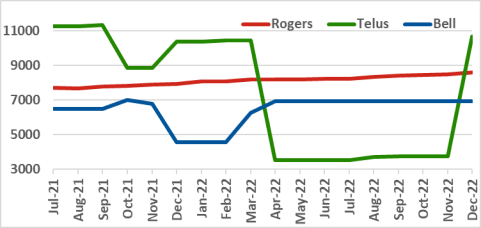
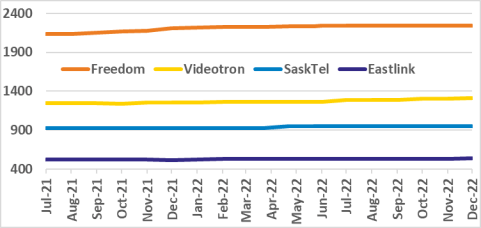
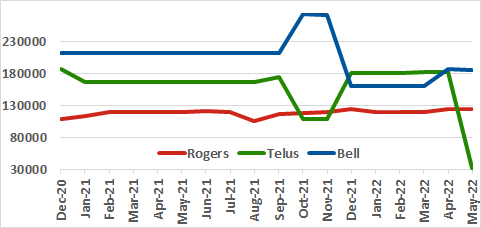
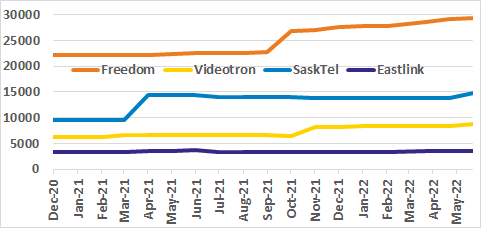
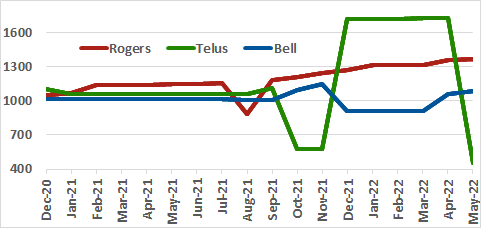
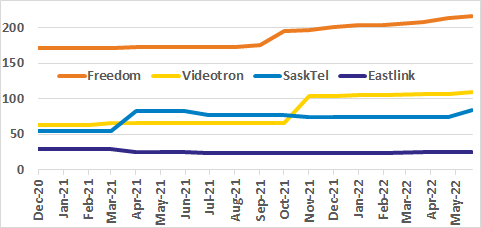
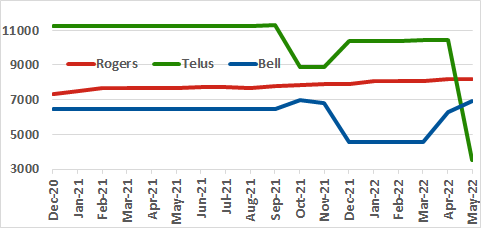
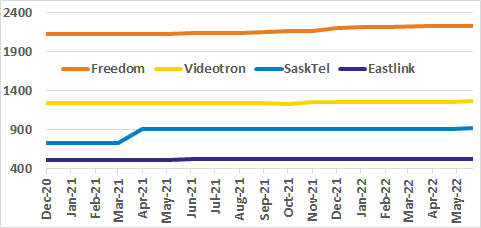
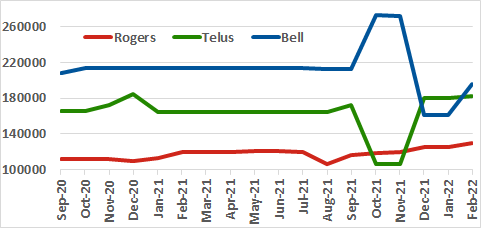
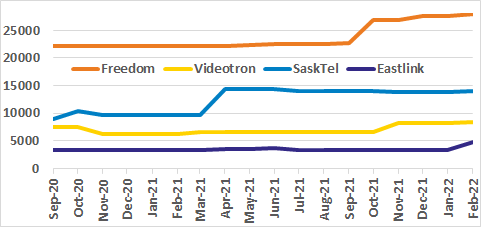
The graphs below plot the past 18 months of
ISED SMS monthly snapshots,
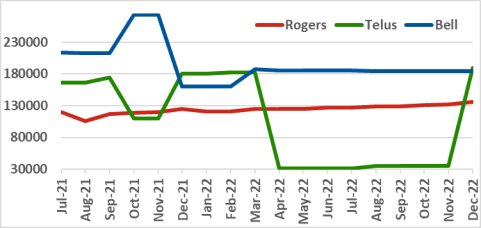
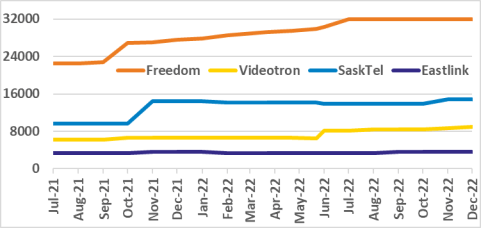
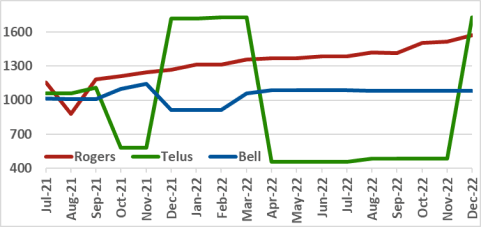
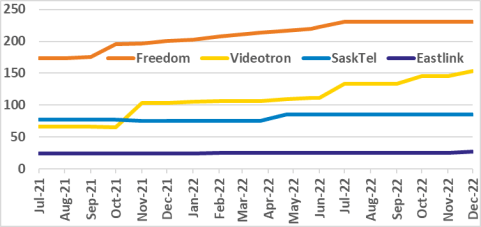
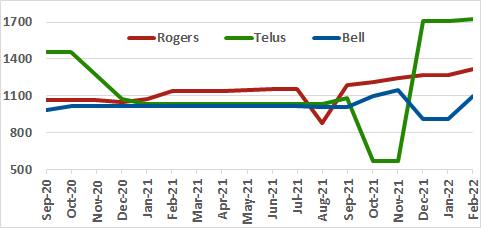
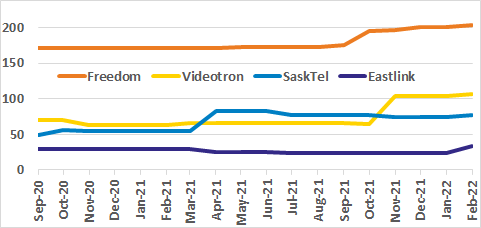
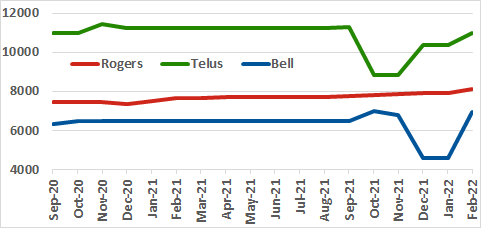
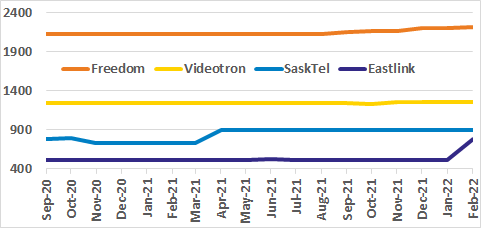
by channel count (top), occupied spectrum (middle) and site count (bottom), for the three national (left) and four regional (right) carriers.
These graphs should trend upwards, to reflect the growing capacity and coverage of these carriers' wireless networks.
However, Telus' see-saw graphs indicate a data issue, originating with Telus, ISED or both.
Although December sees over 100,000 new Telus channels (green line in top-left graph), 10s of thousands of Telus channels remain missing from the most recent ISED SMS monthly snapshot.
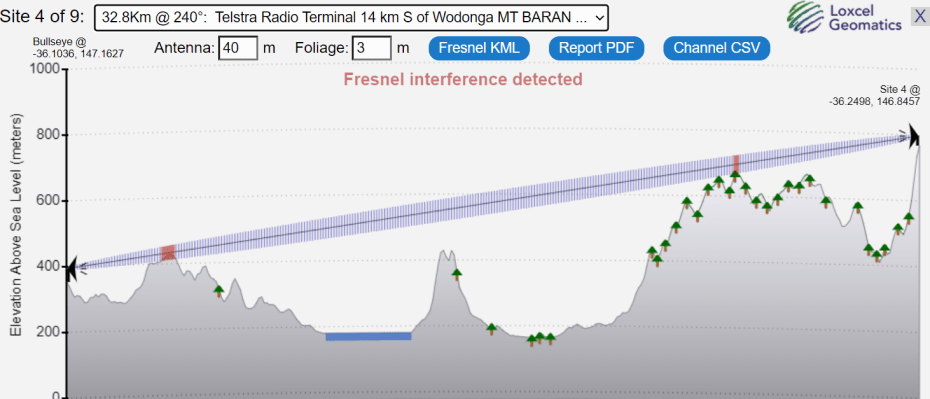
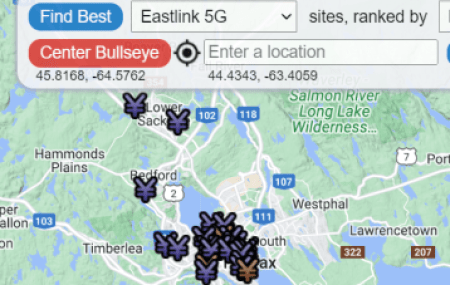
The image below illustrates three recent improvements to the popular
Best Sites
feature:
Clearer and more descriptive presentation (Report PDF looks similar),
Green tree icons identify forest cover (based on
this source), and
Finer terrain resolution identifies Fresnel interference more accurately.
New Look of 'Best Sites'
Rogers 3500 MHz 5G SpectrumTuesday, 2022-Aug-16
Last summer,
Telus,
Rogers,
Bell
and 12 other licensees paid
$8.9 billion
to purchase 3500 MHz spectrum, to offer 5G cellular and fixed wireless service.
Today, Canada Cellular Services
adds Rogers' 3500 MHz spectrum, distributed across 1,093 sites and 3,237 channels, most with 60 - 80 MHz of bandwidth.
These 3500 MHz channels can carry 1,000+ megabits / second to the phone, exhausting a huge
$175 100GB plan
in 15 minutes and leaving the subscriber stranded in 1999, with 3G speeds for the rest of the month.
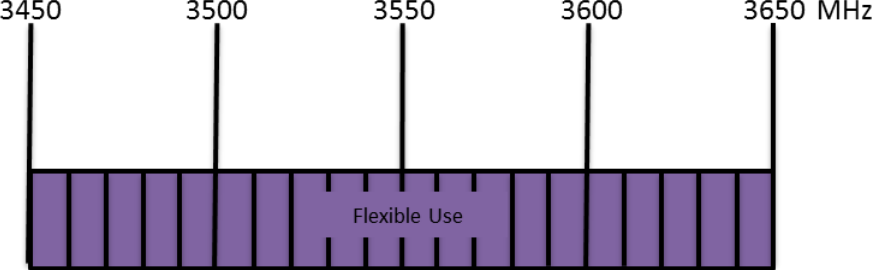
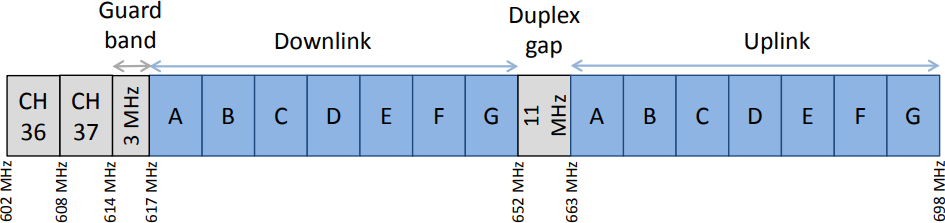
The 3500 MHz band plan (see below) allocates 20 unpaired 10 MHz blocks from 3450 - 3650 MHz.
Some of these blocks were unable for purchase at auction, as they were and remain in use by incumbent licensees.
The random variations in Telus' network shown below represent uncorrected ISED SMS snapshots.
We don't use uncorrected SMS snapshots as-is — and neither should you.
Please contact us
for help in this area.
Channel CountChannel Count
Occupied Spectrum (GHz)Occupied Spectrum (GHz)
Site CountSite Count
Is Canada Behind on 5G? (Revisited)Friday, 2022-Feb-18
Last year
we asked
Is Canada behind on 5G?
Today, the answer remains yes.
ENCQOR 5G
is a provincial / federal initiative to develop 5G applications.
But this initiative will be for not if 5G plan prices remain in the stratosphere and capacities remain in the basement.
Canada's unlimited 5G plans are unlimited only in the claims made and not the value delivered.
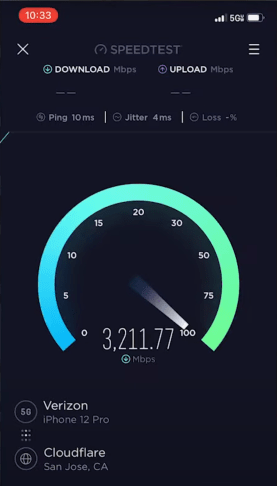
This recent
5G mmWave test
in San Jose California (and captured at right) shows an iPhone 12 Pro downloading at speeds above 3 gigabits per second — more than double the speed of fiber-to-the-home internet.
At this speed, an $80 Canadian unlimited plan would use all its monthly data — in under one minute!
(At least there's SMS to keep you connected.)
One year ago,
we compared
high capacity plans across Canada and Australia.
One year later, Canadian plans have not changed, by one dollar or one bit: $175 for 100G (Rogers); $100 for 50G (Telus).
And throttling policies remain unchanged (and unusable): 0.5 megabits / second.
In contrast, Australia plans have increased capacity and lowered prices: $55 for 300GB (Vodafone); $60 for 500GB (Optus).
And throttling policies remain usable: 10 megabits / second.
Australia and Canada are of similar size and population.
So, what's keeping Canadians from enjoying what Australia already has?
Until we see significant price and capacity improvements, Canadian 5G remains only a marketing slogan.
February SMS UpdateWednesday, 2022-Feb-9
We have documented
many,
manytimes
how each update to
Canada Cellular Services
required us to first solve a
jigsaw puzzle.
It was a manual process, labor intensive, and sometimes overlooked a few sites.
This month brings a new workflow, that replaces the jigsaw puzzle with machine learning algorithms trained by our 15 years experience.
The result is a more accurate account of Canada's wireless landscape, immune to the random variations of uncorrected ISED SMS files.
The graphs below measure Canadian macro and metrocell assets using uncorrected ISED SMS files from the past 18 months.
Compare the dips and peaks with
similar graphs for Australia
which accurately reflect true growth in capacity and coverage.
In short, do not use uncorrected SMS files for any analysis of Canada's wireless networks.
We don't and neither should you.
Please contact us
if you need help in this area.
Channel CountChannel Count
Occupied Spectrum (GHz)Occupied Spectrum (GHz)
Site CountSite Count
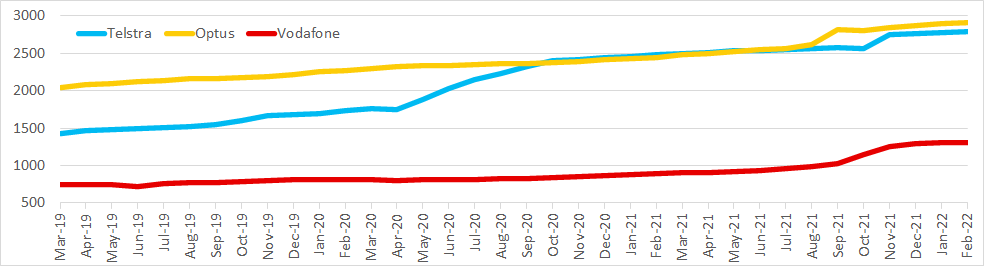
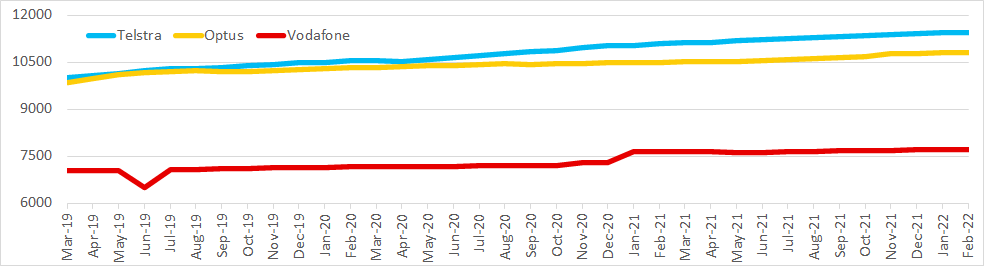
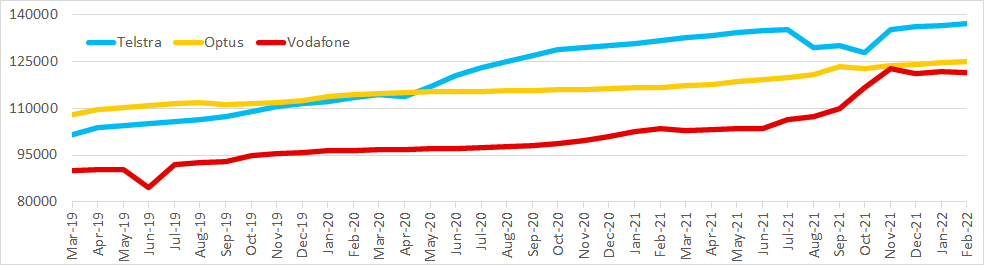
Australia Cellular Services — Data Quality AssessmentMonday, 2022-Feb-7
Australia Cellular Services
uses data published by ACMA, the nation's spectrum regulator.
The graphs below chart this data for the past three years across three metrics: occupied spectrum, site and channel counts.
All graphs increase predictably, and accurately reflect the growth in both capacity and coverage of cellular service across Australia.