Sign In
News
Hello Freedom Mobile, and welcome to Canada Cellular Services. It's not a new carrier, but simply a name change for Wind Mobile, with a cute mascot! We're looking forward to the rollout of their new LTE network, in the new year.
Also, we'd like to wish our clients and friends a Merry Christmas and all the best for 2017.

Canada and Australia Cellular Services' Historical View is a popular feature now available to most subscribers. It's a window into the past, letting you observe how a site grows, either through new radio channels, or tenants.
Today, we have expanded this window, to show the current and previous three months, in addition to the 1 and 2 year old views.
We have data as far back as 2004, so if you'd like this Historical View to expand further, please let us know.
Closest Sites is one of the most popular features of Australia and Canada Cellular Services, and a quick & easy way to identify signal interference between your location and nearby cellular & wireless broadband sites.
A few of our clients asked if we could expand this feature to capture the effect of foliage, such as tall trees, on signal interference. Today, we can answer Yes!
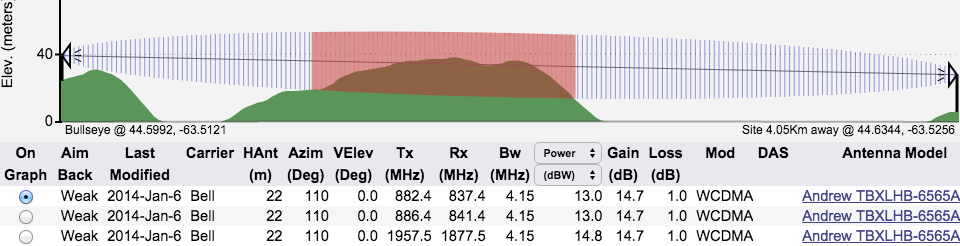
Consider the dark green topographic graph below. No signal interference detected because it does not consider foliage:
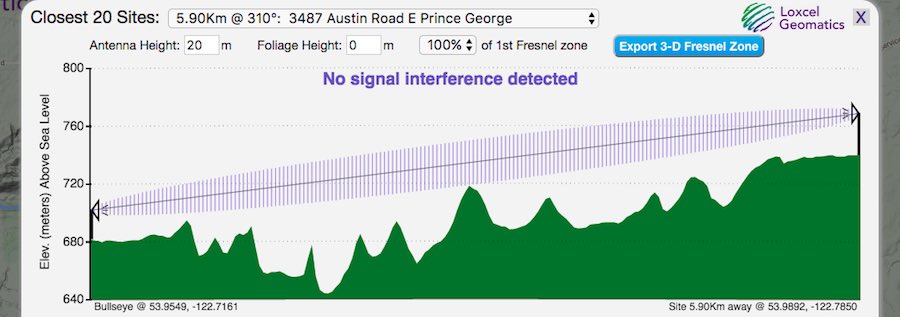
In comparison, the analysis below adds 15m of foliage, shown in pale green. Suddenly, five red zones appear, hilighting where foliage might cause signal interference:
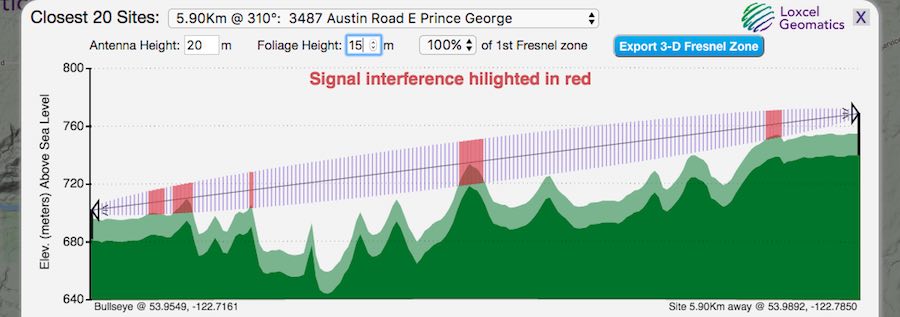
If you use Firefox, Safari or Chrome, the Fresnel zone and foliage graph redraw each time you change the Antenna Height or Foliage Height parameter, via the cursor up / down keys.
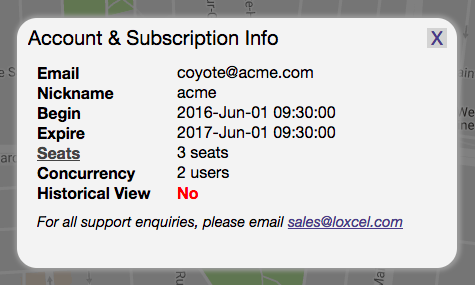
After you sign in, a new Account button will appear to the right of the Sign Out button. Click it, to display information about your account and subscription.
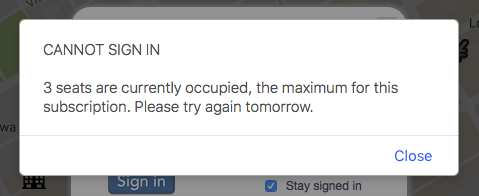
This information also includes how many people can share your subscription throughout the day (seats), and how many of these people can sign in at the same time (concurrency). At the right, we see that up to three people can sign in as acme throughout the day, with up to two at the same time.
Finally, this pop up tells you if your subscription has a historical view, which lets you see the cellular network as it existed in the past. Subscriptions created on or after July 28th, 2016 include historical view. (If your subscription does not, please contact us and we will add it to your subscription for free.)
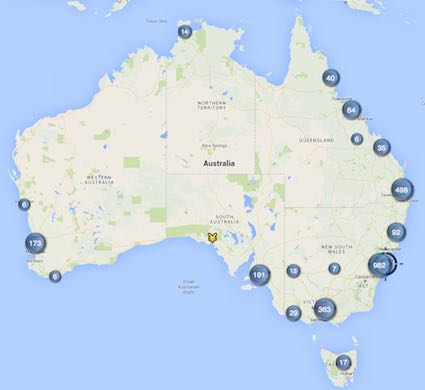
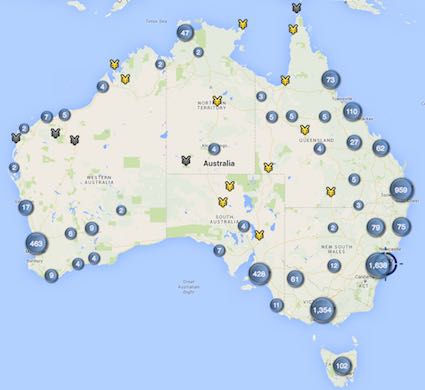
The historical view lets you observe growth in cellular site counts:
| Carrier | Aug 2014 - Jul 2015 | Jul 2015 - Aug 2016 |
|---|---|---|
| Rogers | 8.9% | 6.8% |
| Telus / Bell | 2.7% | 9.7% |
| WIND | 1.4% | 8.5% |
| Videotron | 7.2% | 2.4% |
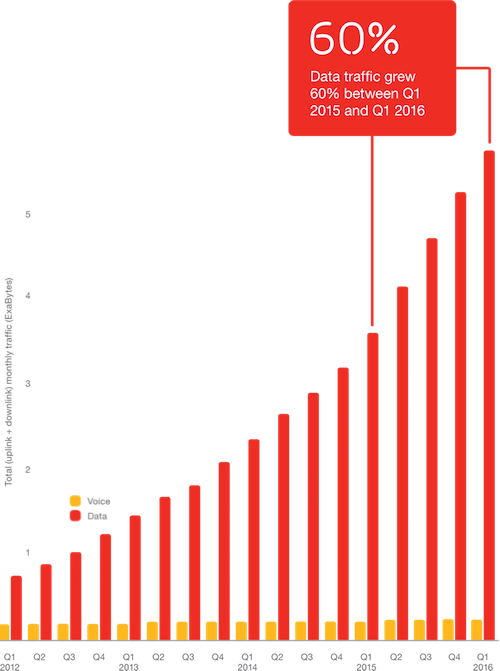
Analysts sometimes use site counts to track network capacity. The graph (at right) shows that global data traffic grew 60% between 2015Q1 and 2016Q1. Compare this graph to the table above. Assuming Canada's data traffic grew similarly to the global average, growth in site counts significantly lags growth in network capacity.
As we predicted in an interview with the Toronto Star in 2013:
Changing usage patterns supported by gigabyte smartphone data plans will require carriers to deploy even more antenna ... but that doesn't necessarily equate to more towers [sites].
Let's look at growth in antenna capacity, instead:
| Carrier | Aug 2014 - Jul 2015 | Jul 2015 - Aug 2016 |
|---|---|---|
| Rogers | 23% | 37% |
| Telus / Bell | 54% | 12% |
| WIND | 3% | 28% |
| Videotron | 40% | 92% |
It appears that growth in antenna capacity — not site counts — more closely models growth in data traffic. This makes sense, as it's faster and more economical for a carrier to deploy spectrum on an existing site than a new site. In fact, most of the MBS 700MHz spectrum was deployed on existing sites.
In summary, network capacity is best measured — not by site counts — but by antenna capacity.
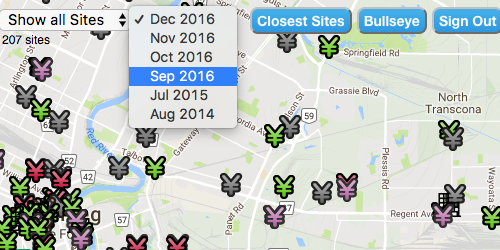
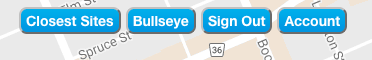
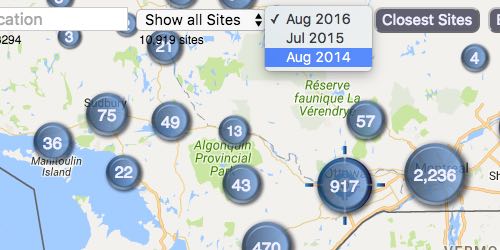
The Canada and Australia Cellular Services now let you look into the past. A new drop-down control, to the right of the filter and to the left of the Closest Sites button, lets you choose where to look.
The Canada Cellular Services (at right) currently offers three historical views: current month, 1 & 2 years ago. Select one, to see how Canada's cellular & wireless broadband networks looked on that date.
The Australia Cellular Services (not shown) offers two historical views: the current month and Feb 2016.
This historical view also introduces a few other changes:
Historical view is a new feature available to subscriptions created on or after July 28th, 2016. If your subscription was created before this date, please contact us for more information.
A subscription allows one person to sign in at a time. Depending on the seat limit, a sign in is possible from multiple computers throughout the day (from midnight to midnight, Eastern Time / New York), allowing the subscription to be shared:
| Subscription | Seat Limit |
|---|---|
| Australia Cellular Services | 3 seats |
| Canada Cellular Services | 3 seats |
| New Zealand Cellular Services | 3 seats |
| 3D Fresnel Zone | 1 seat |
Update: You can now view your subscription's seat limit.
Consider this example, where you and your co-workers share a Canada Cellular Services subscription:
| Eastern | Activity |
|---|---|
| Time | |
| 08:00 | You sign in from your home computer and acquire seat #1. |
| 08:30 | You sign out, and commute to work. |
| 09:00 | Stan signs in from his computer, and acquires seat #2. |
| 09:10 | You attempt to sign in from your work computer — but fail — because Stan is signed in. |
| 10:00 | Stan signs out. |
| 11:00 | You sign in from your work computer and acquire seat #3. |
| 11:30 | You sign out. |
| 14:00 | Mary attempts to sign in from her computer — but fails — because three seats are occupied. |
| 19:00 | You sign in from your home computer, using seat #1 acquired at 08:00. |
| midnight | All three seats are released, free to be reacquired. |
Notes:
We can customize your subscription's seat limit (or multi-user concurrency limits) to meet any requirements, from a small office to a large enterprise. Please contact us for details & pricing.
This week's updates improve coverage for both the Canada and Australia Cellular Services.
Canada's updates include
Australia'a updates include
This is the largest update to the Australia Cellular Services since it launched two months ago.
Ground truth means to verify by direct observation, and is a necessary step before putting any data to work.
Canada's cellular & wireless broadband licensees publish data about their networks' locations and radio emissions. Unfortunately, this data has duplicate records, vast omissions and positional and addressing errors.
An organization that makes decisions directly from this raw data exposes itself to risks and liabilities.
Our quality control team regularly survey site location and address. These surveys also identify co-locations, site type and roadside views.
Also, our nation-wide customer base inform us of variances between what Canada Cellular Services says and what they observe in the field.
Our Data Detectives — internal and external — are constantly reviewing and improving the quality of this data, used by the Canada Cellular Services and custom reports.

One example involves two Data Detectives from Western Canada, who recently observed cellular activity from a band that did not appear on the Canada Cellular Services. They immediately informed us of this variance, which we confirmed, obtained the missing data and restored the missing coverage. This restoration added 4,000 antenna channels to the Canada Cellular Services.
It's all about providing the best data and tools to help you make smart decisions concerning the growth, distribution & efficient use of cellular & wireless broadband assets across Canada.
2G site counts remain stable at 4,231, but 2G channel counts continue to drop (% change since April):
| Province | 850MHz | 1,900MHz |
|---|---|---|
| British Columbia | -41% | -26% |
| Alberta | -38% | -21% |
| Manitoba | -36% | -7% |
| Saskatchewan | -42% | 4% |
| Ontario | -42% | -30% |
| Quebec | -40% | -23% |
| New Brunswick | -28% | 0% |
| PEI | -41% | -10% |
| Nova Scotia | -28% | -5% |
| Newfoundland | -39% | 0% |
2G capacity in the 850MHz band has dropped precipitously in every province, whereas 1,900MHz capacity has dropped somewhat less. This shedding of 2G capacity is consistent with past trends. In summary, 2G channel counts currently stand at 14,845, a 33% drop from April.
Since April, 700MHz site counts increased 13% from 6,792 to 7,690, with Quebec and Ontario accounting for most of this gain.

Subscription pricing is the same for Australia or Canada. One subscription gives you access to either Australia or Canada Cellular Services.
Visit the subscribe page for more information, or if you have any questions, please contact us.
According to Canada's Wireless Policy:
As of summer 2015, the amount of spectrum available to provide mobile services to consumers has grown by almost 60 percent since early 2014. This is the largest amount of spectrum ever released in such a short time in Canada, allowing Canadians and their families to benefit from the latest technologies and world-class services.
Large chunks of spectrum has been released, but as this graph shows, some people have access to more of it than others:
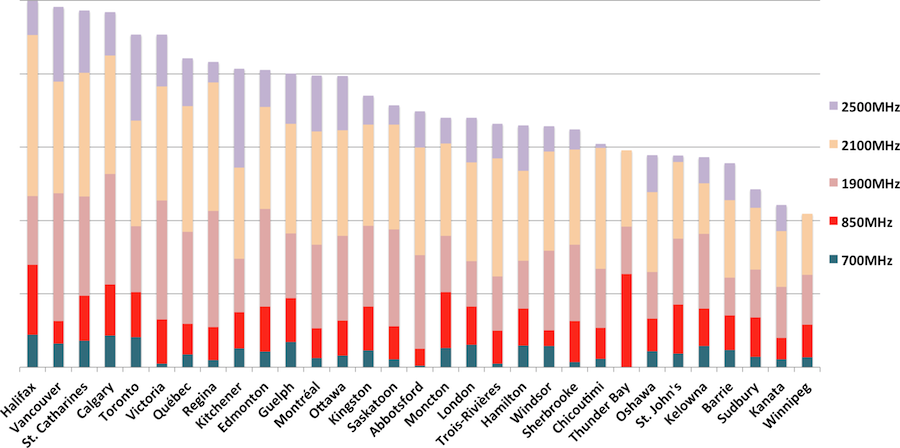
Each vertical bar represents the amount of spectrum deployed at the cell site, divided by the census population, for Canada's 31 largest urban areas. Each bar is divided into colored segments, representing the cellular bands deployed (see legend at right). Units aren't important here, as we're interested in variance among urban areas, not absolutes.
The graph shows great variance across Canada, with Halifax on top, closely followed by Vancouver, St. Catharines and Calgary.
If you would like to dig deeper into these statistics, please contact us.
Last fall, we posted construction photos of Bell site W4925, a stealth monopole. This time, we look a little deeper:
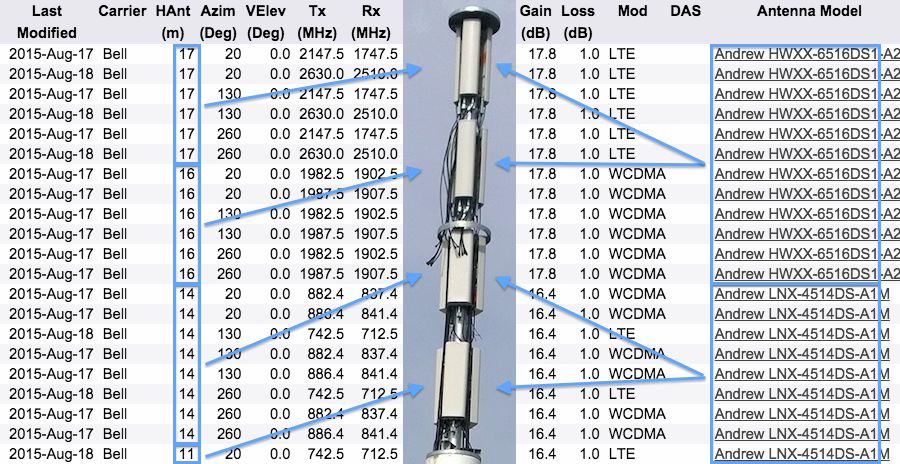
With its shrouding removed, starting from the top of the monopole, we see three Andrew HWXX-6516DS1 quad port antennas at 17m above ground and three more at 16m. Just below, are three Andrew LNX-4514DS antennas at 14m and three more at 11m.
These antennas face 20°, 130° and 260°. For the three at 11m, only the one antenna facing 20° is active.
According to the specs below, the six HWXX-6516DS1 antennas at 17m and 16m are taller and narrower than the six LNX-4514DS antennas at 14m and 11m, and is consistent with their appearance in the photo above.
| LNX-4514DS | HWXX-6516DS1 | |
|---|---|---|
| Gain (dBi) | 15.5 - 16.4 | 17.4 - 18.6 |
| Length (mm) | 1,308 | 1,390 |
| Width (mm) | 389 | 305 |
Finally, all channels show a 1.0 dB line loss, which suggest this site uses tower-mounted remote radio units (RRUs).
Last week, we reported 752 DAS sites. Since then, we've been scouring our database and have found even more DAS sites, bringing the total to 1,007 sites.
Here's the current total, by carrier:
| Carrier | DAS Sites | DAS Antennas |
|---|---|---|
| Rogers | 431 | 1,124 |
| Bell | 319 | 1,696 |
| Telus | 282 | 1,637 |
| SaskTel | 16 | 302 |
On a related note, the comment section from this article mentions small cell sites in Victoria, BC. The Canada Cellular Services shows many of these sites, typically Telus sites with antennas 4 - 8m above ground level.
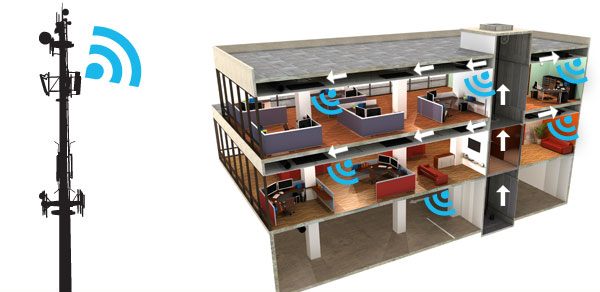
A Distributed Antenna System (DAS) is a network of small, low-power antennas, cabling and radios that provides cellular service to a small, confined area, often inside a building, stadium or similar structure.
Last week, 752 DAS sites were added to the Canada Cellular Services — depicted with the same icons we use for cellular sites. The picture below, at the left shows the location of nine DAS sites in downtown Ottawa.
Do you see them?
Neither could one of our trusted advisors, who had this to say:
Showing indoor sites along with outdoor sites is a bit misleading, as it seemed to suggest there are more sites out there than there really is. None of the indoor sites will have any impact on someone outdoors.
As shown at the right, DAS-only sites are now depicted with a building icon:
On a related note, we've added two DAS-related filters:
| Filter | Meaning |
|---|---|
| DAS | Show only sites with one or more DAS channels (eg. cell antennas on roof, DAS installation on floors below) |
| 100% DAS | Show only sites whose channels are all DAS (always depicted as a building icon) |
The number of channels reported by Canada Cellular Services does not always equal the number of antennas you will see if you physically visit the site. And the reason why has to do with economics:
This single-band cellular site can economically deploy one antenna per channel:
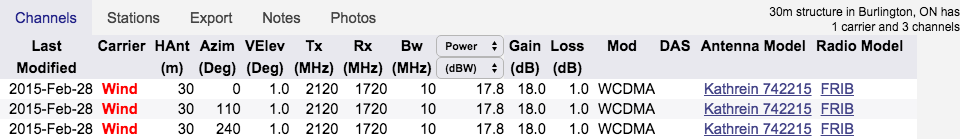
Larger multi-band sites, however, face different economics, and typically deploy multi-array antennas in a single radome, reducing
For example, this large, multi-band site deploys approximately one antenna for every two channels:
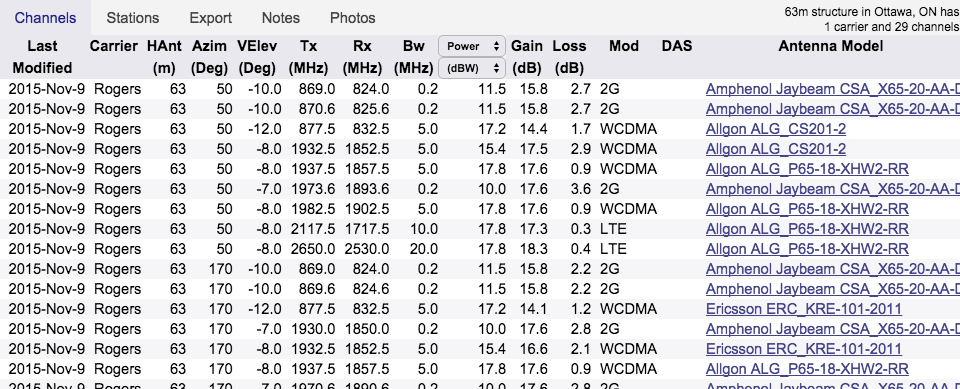
In summary, a large, 30-channel site might have only 10 to 20 antennas.
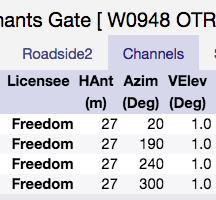
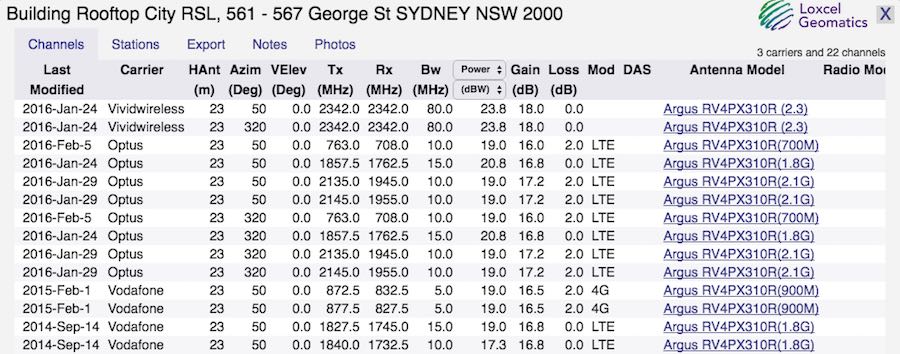
Antenna and radio information is now listed under the Channels Tab:
(Values that match the filter (ie. Wind) are in red.)
| Column | Meaning |
|---|---|
| Last Modified | When the channel was last modified or made operational |
| Carrier | Carrier licenced to broadcast on this channel |
| HAnt (m) | Height of physical centre of the Tx antenna above ground level including the structure / building on which the antenna is mounted |
| Azim (Deg) | Either (a) Omni if Tx antenna is omnidirectional, or (b) azimuth in degrees from true north of the Tx antenna's direction of maximum radiation |
| VElev (Deg) | Tx antenna's vertical elevation angle of the main lobe with reference to the horizontal ground in degrees. This includes any mechanical and electrical beam tilt. Angles above the horizontal ground are considered positive |
| Tx (MHz) | Centre frequency of the Tx channel |
| Rx (MHz) | Centre frequency of the Rx channel |
| Bw (MHz) | Occupied bandwidth of the emission Tx signal. It corresponds to the bandwidth containing 99% of the transmitted power |
| Power/EIRP (dBW)/(Watts) | Choose either: (a) Power — Power fed to the transmission line, or (b) EIRP — Effective Isotropic Radiated Power is power combined with antenna gain and line loss (is for a single channel and not cumulative of all Tx channels via the same antenna) |
| Gain (dB) | Gain of the Tx antenna expressed relative to an isotropic radiator (dBi). For a directional antenna, it is the gain in the direction of maximum radiation |
| Loss (dB) | Total Tx line losses, including cable and connector losses. This value is used to calculate the effective isotropic radiated power (EIRP) |
| Mod | Modulation Technology: LTE, HSPA+, CDMA, WCDMA |
| DAS | Distributed Antenna System (DAS) or similar Zone Enhancer that establishes / extends call & data capacity, where coverage / capacity is inadequate from nearby macro site |
| Antenna Model | Tx antenna manufacturer & model number. Click to perform a Google search for more details |
| Radio Model | Tx radio manufacturer & model number. Click to perform a Google search for more details |
The Closest Sites tool adds two columns to the left of the Last Modified column:
Their descriptions are as follows:
| Column | Meaning |
|---|---|
| On Graph | Click radio button to visualize channel on topographic graph, along with line-of-sight and Fresnel Zone. |
| Aim Back | Directionality back to the location of the bullseye. See here |
If you have any comments or questions about these changes, please contact us.
You need accurate and timely information.
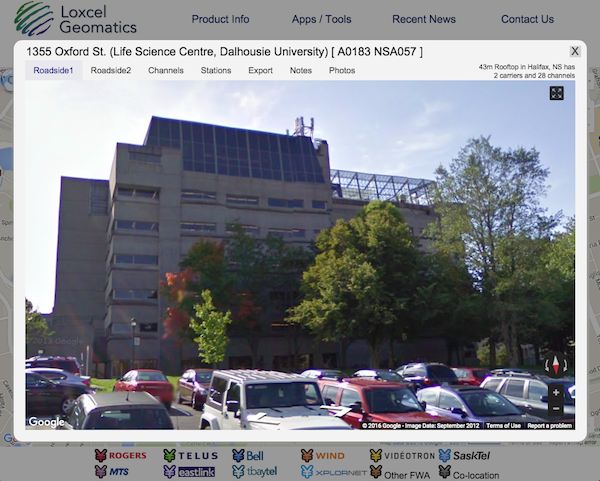
That's why we're using aerial and satellite imagery to identify each site's structure type (rooftop, monopole, lattice, etc) and pinpoint its exact location. We're also capturing roadside views to let you visualize & explore a site's antennas and related equipment (see at right). These roadside views also help us provide you with improved street address, and where available, property name and contact info.
Right now, about 1,000 sites across Canada (mainly in Halifax, Winnipeg and parts of the Greater Toronto Area) include Roadside Views and new information.
Over time, we'll expand coverage to all 19,000 sites across Canada, providing you the best source for information about Canada's cellular and wireless broadband landscape.