Australia Abandoned mmWave Expansion. Why Is Canada Auctioning It?Wednesday, 2026-Jul-08
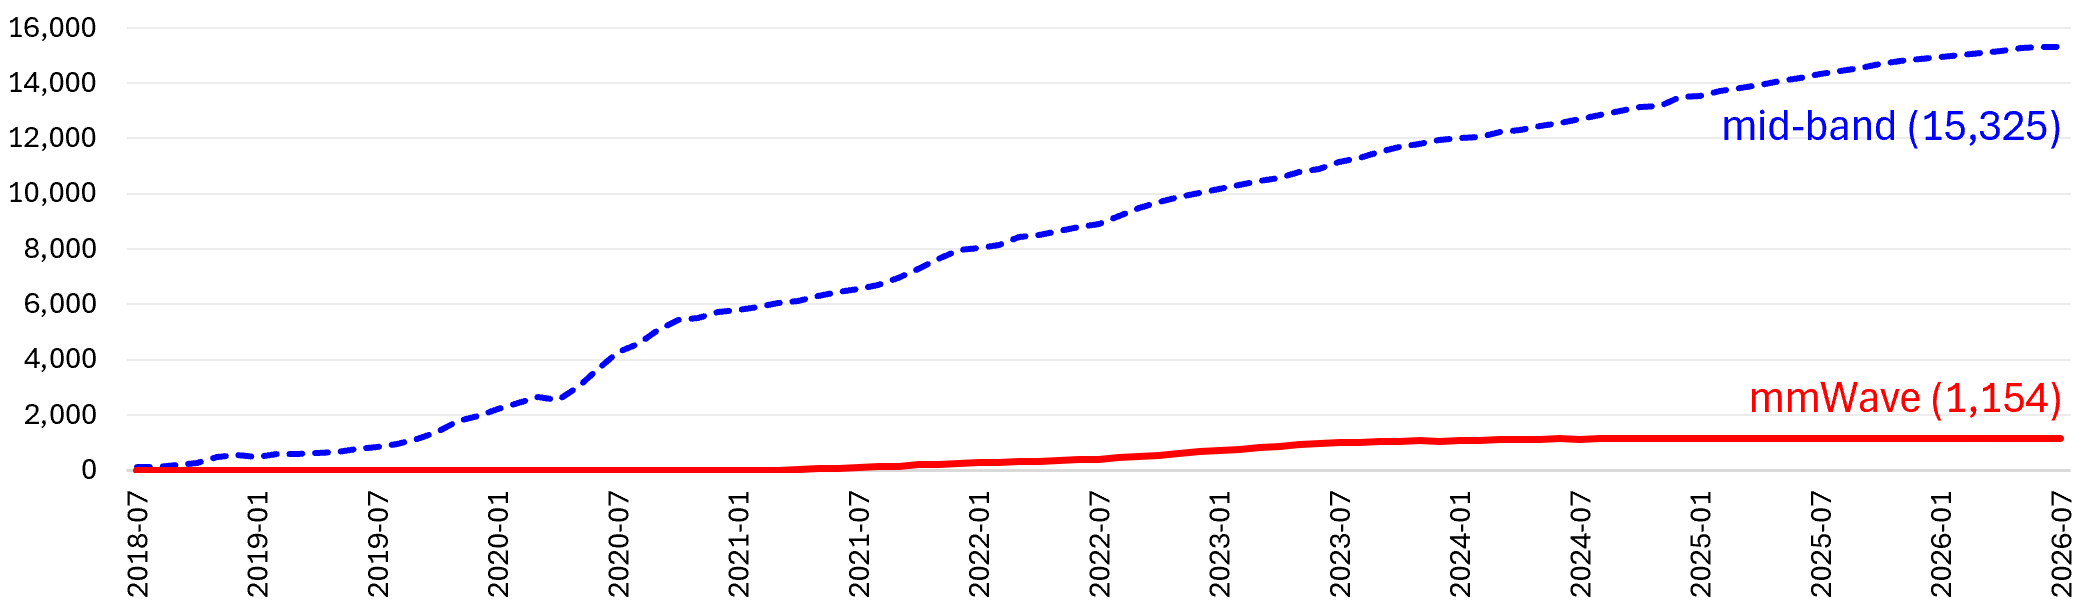
Over the past 18 months, Australia added 1,624 mid-band cellular sites and just 8 mmWave sites. The installed mmWave base remains, but expansion has effectively been abandoned.
mmWave was supposed to add capacity in crowded places where existing mobile networks become congested.
Australia's operators tried it, then stopped building more.
Vodafone, Telstra and Optus had all deployed mmWave by 2021.
Annual additions peaked at 600 sites in 2022-23, then fell to 128, 24, and just 2 last year.
As the graph below shows, mid-band has continued past 15,000 sites while mmWave has flattened just above 1,000.
Australia is not alone.
South Korea, one of the world's earliest 5G markets, succeeded with mid-band but not with mmWave.
The Korean government assigned both 3.5 GHz and 28 GHz spectrum in 2018, imposed build requirements, encouraged operators to expand 28 GHz networks, funded validation and pilot projects, and promoted 28 GHz use for subway Wi-Fi backhaul.
Even so, operators built only about 10% of what they had promised, and
the regulator cancelled
the 28 GHz assignments of LG Uplus and KT in 2022, later cancelling SK Telecom's as well.
In both Australia and South Korea, operators did not keep finding enough targeted sites worth building.
That should matter to Canada.
Canada is preparing a
2027 mmWave auction
for 4.8 GHz of spectrum in the 26 GHz and 38 GHz bands.
But Australia's experience raises the obvious question: if operators tried mmWave in Australia and then abandoned expansion, why should Canada expect a different result?
Australia had mmWave spectrum and operators.
What it did not have was a sustained business case for adding more mmWave sites.
Canada is not early to mmWave; it is arriving after other advanced markets have already exposed the weak deployment case.
Unless Canada has better deployment economics than Australia did, its mmWave auction risks the same fate.
Ottawa can auction spectrum, collect proceeds, and say it advanced 5G policy.
But an auction does not create demand.
If mmWave cannot justify sustained buildout, the outcome is licensed spectrum with little subscriber value.
Site Counts Understate the Economic Gap
Australia now has 15,325 mid-band sites versus 1,154 mmWave sites, a ratio of 13-to-1.
The table at the right shows that mmWave expansion has stopped while mid-band deployment continues.
But site counts alone understate the real deployment problem.
For outdoor coverage, mmWave's shorter range and dependence on near-line-of-sight mean each site covers far less area than a mid-band site.
Using coverage distances of 200 m for mmWave and 2 km for mid-band, a mmWave cell covers about 1/100th the area.
Combining site counts with coverage area, the outdoor footprint gap is closer to 1,000-to-1 than 13-to-1.
Annual Site Additions (Jul-Jul)
Period
mid-band
mmWave
2018-19
701
n/a
2019-20
3,437
n/a
2020-21
2,288
109
2021-22
2,341
291
2022-23
2,246
600
2023-24
1,556
128
2024-25
1,629
24
2025-26
1,005
2
mmWave additions peaked in 2022-23 and have fallen every year since.
Expansion has effectively stopped.
Why Expansion Was Abandoned
mmWave only works where several conditions line up: heavy traffic demand, clear line of sight, affordable mounting locations, available backhaul, compatible devices, and no cheaper substitute such as mid-band densification or Wi-Fi offload.
Australia found some of those locations, but not enough to sustain a rollout.
That is the warning for Canada: a mmWave auction will only matter if the deployment economics are different.
Conclusion
Australia's mmWave rollout lifted off, peaked quickly, and then halted, while mid-band continued to scale.
The installed mmWave base remains, but expansion has been abandoned.
That is the warning for Canada.
A 2027 auction can sell licences, but licences are not networks.
Unless Canada can explain why mmWave economics will be better here than they were in Australia, the auction risks producing little meaningful value for Canadian wireless subscribers.
Subscriptions of 1 month or longer are non-refundable.
The 48-hour subscription provides short-term access to Cellular Services at a low cost. A refund for a 48-hour subscription is available only if no user signed in during the subscription period.
3D Fresnel Zone KML Generator subscriptions are non-refundable.
You can use this service for free with limited functionality, including changing fields in the green zone but not the blue zone, to determine whether it meets your needs.
If a subscriber is unable to access Cellular Services or 3D Fresnel Zone KML Generator because of a verified service issue within Loxcel's control, we may extend the subscription period by a reasonable period corresponding to the verified service unavailability.
This extension is the only remedy available to you; there are no full or partial monetary refunds.
Subscriptions provide access to use the services during the subscription period. They do not transfer ownership of Loxcel software, data, maps, methods, or other intellectual property, and do not permit resale, redistribution, automated extraction, scraping, or bulk copying except as expressly allowed by Loxcel.
By purchasing a subscription to any service mentioned above, you indicate that you understand and agree to all terms listed above.
Please
contact us
if you have any other questions.
3D Fresnel Zone KML Export UpdatedFriday, 2026-May-08
Optimize wireless links in
Google Earth Web
with guided views, site antenna models, and improved Fresnel-zone visibility.
A wireless link depends on more than a clear line of sight. Around that line is the Fresnel zone: a 3D area where terrain, trees, or buildings can still affect the signal. If too much of that zone is blocked, capacity and reliability can suffer.
Google Earth Web can make that hidden Fresnel zone visible over real terrain. Instead of relying only on a path profile, users can rotate around the path and see where terrain, trees, or buildings may begin to affect link quality.
Loxcel has supported this kind of visual path review for years through its 3D Fresnel Zone KML export, both after
Find Best
identifies candidate cellular sites and in the standalone
RF Link & Fresnel Zone KML Tool
when both endpoints are already known.
The updated export makes that Google Earth workflow much more useful. The KML now opens with a readable path summary and a better-organized folder tree. It also adds guided viewpoints, site geometry with antenna panels, upper and lower Fresnel rendering, endpoint elevation adjustment, and free-space path loss.
In addition to line of sight, Fresnel geometry, and milestones, the export now gives users a fuller RF inspection view around the path.
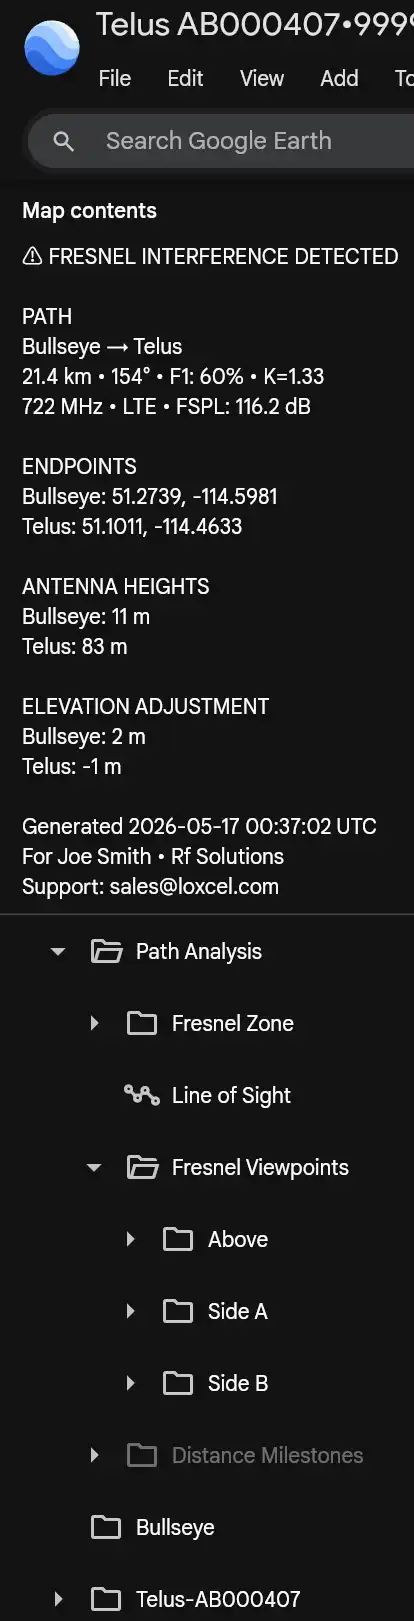
Improved Path Summary
The KML description panel has been updated for Google Earth Web.
It now shows key path details: distance, bearing, Fresnel percentage, K-factor, frequency, free-space path loss, endpoint coordinates, antenna heights, elevation adjustments, and support contact.
That keeps the RF context visible while users review the terrain, line of sight, Fresnel zone, viewpoints, and site geometry.
Endpoint Elevation Adjustment
Google Earth’s terrain and Loxcel’s elevation source are not always identical at endpoint locations.
Because the KML geometry is positioned using above-sea-level (ASL) elevation, a difference between the two terrain models can make the line of sight and Fresnel zone appear too high or too low relative to Google Earth’s visible ground.
The updated KML export includes Bullseye and Site elevation adjustments for 3D KML.
You can tune each endpoint to align the line of sight and Fresnel zone with the Google Earth scene.
Fresnel Views Built for Inspection
The KML now includes a Fresnel Viewpoints folder with views from above and from both sides of the path, plus optional camera views at distance milestones.
Users can review the path step by step from one endpoint to the other, making it easier to check the entire route.
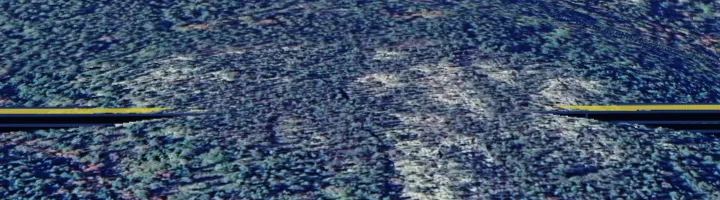
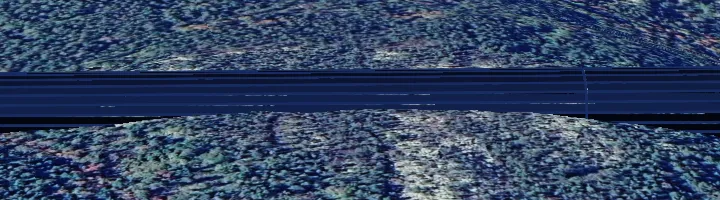
More importantly, the top half of the Fresnel zone can be turned off while the bottom half remains visible. That small change makes obstruction checks much easier because terrain, trees, or buildings are no longer hidden behind the upper surface.
Improved Path Summary
Terrain obstruction is visible with the Fresnel top half hiddenTerrain obstruction is obscured with the Fresnel top half shown
Google Earth Web view showing the line of sight, Fresnel zone, and donor site geometry in terrain context.
Better Google Earth Web RF Inspection
Together, these updates make the KML export more useful in Google Earth Web.
Users can review the path, inspect Fresnel clearance, adjust endpoint elevation, and keep RF context visible while working directly in Google Earth Web.
Finding Tower Space in Canada Just Got EasierWednesday, 2026-Apr-08
Finding tower space in Canada has never been straightforward. Canada Cellular Services changes that by bringing 3,520 towerco sites into a single searchable platform, alongside carrier emissions, tenant occupancy, and vertical antenna stacking.
3,520 independently owned sites, in one place
Canada Cellular Services now includes tower portfolios from Terrion (2,816 sites), Aurora Towers (583 sites), and Shared Tower (121 sites) — bringing 3,520 independently owned tower locations into a single searchable environment alongside Canada's wireless infrastructure.
Users can filter directly by owner, or by tenancy status: Vacant, Solo (single-tenant), or Co-lo (multi-tenant). The result is an immediate, actionable view of where co-location capacity exists across the country.
What a tower company is, and why it matters
In the United States and across Europe, tower ownership and wireless network operation separated long ago. Companies like American Tower, Crown Castle, and SBA Communications own the physical infrastructure. Carriers lease space on it. Towers are designed from the outset to host multiple tenants, approval processes are streamlined, and operators can focus capital on spectrum and network rather than steel and concrete.
Canada has been slow to adopt this model. Only 10% of towers in this country are owned by independent tower companies. The major carriers — Bell, Rogers, and Telus — have historically owned the towers they use, and that concentration has made infrastructure access difficult for smaller operators and new entrants alike. Terrion, Aurora Towers, and Shared Tower are changing that, and their portfolios are now fully integrated into Canada Cellular Services.
Why co-location changes the deployment calculus
A conventional tower build in Canada — site selection, municipal consultation, permitting, community opposition, construction — routinely takes twelve months or more. NIMBYism is real, and it is expensive. Terrion advertises 30-day co-location approval on existing structures. That's the difference between 30 days and 365. For an MNO trying to densify a network or deploy new spectrum, that is not a marginal improvement. It is a fundamentally different operating model.
The towerco model works because the infrastructure is designed for shared use from the start. Towers are sized and structured to accommodate multiple tenants stacked vertically, each at its own mounting height, azimuth, and tilt. The tower company handles the structure; the carrier handles the radio.
What Canada Cellular Services shows you
Knowing a towerco site exists is only the beginning. The harder questions are: who is already on the tower, where are they positioned, and is there room for another tenant without compromising signal quality? Canada Cellular Services shows who is on each tower, where they are mounted, and whether space remains for additional tenants without interference risk.
For each site, users can identify existing tenants, distinguish vacant from occupied structures, view antenna stacking positions by tenant, assess mounting height, azimuth, and vertical tilt, and evaluate vertical separation between tenants — the critical factor in managing interference between co-located carriers.
Each site can also be
exported as a 3D KML model. Panels are color-coded by tenant, positioned at actual mounting heights, oriented by azimuth, and scaled by frequency band — higher frequencies appear as shorter panels. This gives site acquisition teams and RF planners a concrete picture of available space and deployment constraints before a single site visit is scheduled.
For tower companies, this is not just visibility — it is distribution. Canada Cellular Services is used by carriers and site acquisition teams to identify deployment opportunities. Ensuring that a portfolio is accurately represented — including structure attributes, tenancy visibility, and availability — directly improves how sites are evaluated for co-location.
For operators and investors
The towerco model generates long-term contracted revenue with inflation-linked escalators and low tenant churn — which is why it attracts serious institutional capital. Northleaf Capital committed C$100 million to Shared Tower in early 2025. Canada's towerco sector is early and the inventory is still being built. For private equity and infrastructure investors, understanding what exists today — where sites are, who occupies them, and what capacity remains — is the starting point for any credible analysis.
Loxcel has been mapping Canada's wireless networks for over 15 years
Canada Cellular Services is not a new entrant to this data. Loxcel has spent more than fifteen years building and maintaining the most detailed picture of Canada's wireless infrastructure available anywhere — carrier emissions, spectrum licenses, antenna configurations, and site-level detail. The towerco integration adds a new layer to a dataset that operators, regulators, and investors have relied on for well over a decade.
No other platform in Canada currently offers this combination: independent towerco inventory, carrier emission data, tenant identification, and 3D site visualization — in a single searchable environment.
Canada Cellular Services is the starting point for identifying tower co-location opportunities in Canada.
We have updated our backoffice workflow that ingests ISED Spectrum Management System (SMS) data.
The result is a stronger, cleaner, and more defensible national data foundation powering our reports and the
Canada Cellular Services platform.
Innovation, Science and Economic Development Canada (ISED) manages Canada's radio spectrum. Licensees submit technical RF data into ISED’s Spectrum Management System (SMS), and ISED publishes those submissions as
monthly downloads
that appear to be national snapshots of Canadian spectrum deployments. They are not. ISED has publicly acknowledged the need to improve data quality, reliability and uniformity within SMS.
In practice, SMS is a cumulative record of submissions rather than a clean monthly replacement of what changed. Older records linger, and updates may appear late or not at all. Months with no visible change do not mean the network is stable — they often mean no new submissions were processed. The transactional UPDATE / APPEND / REPLACE nature of the
submission process
adds further risk. Treating each monthly file as a clean snapshot leads to unreliable conclusions. Serious longitudinal analysis must reconcile cumulative submissions, upload chronology, and transactional overwrite events.
Our updated workflow is built around that reality. We reconcile cumulative submissions into coherent state transitions, filter stale and superseded records, remove structural duplicates, resolve site relocations, detect anomalous overwrite events, and restore (backfill) emissions when valid spectrum is temporarily removed due to transactional errors. The result is an operational representation of Canada’s wireless infrastructure — not a raw administrative extract.
The workflow is now live and continues to be refined as we identify edge cases and resolve residual inconsistencies.
The ISED SMS files are free. Extracting reliable network intelligence from them is not.
For RF technicians, operators, and site acquisition or investment firms, the risk isn’t downloading the data. The risk is making decisions based on it at face value.